Neural Nets 101
Neural networks are a powerful tool to model complex mathematical relationships that exist, such as in sports. No single factor leads to why Team A will beat Team B by a certain amount. This same idea applies to things like gaining weight. For example, people consume calories (protein acquired from protein bars, carbs, and fat) as well as burn calories (exercise and normal body usage). This information can be used to create a linear relationship about how much weight a person gains or loses each day (approximately):

The above case shows a simplified, linear process in which people understand why they are gaining or losing weight. Being able to predict winners of sporting events, or even who is going to cover the spread, is not as easy. There are so many possible factors that go into the outcome of the game which include health, offense/defense matchups, venue, streaks, time off, current stats, etc. Many experts use their own personal opinion and experience to determine the right “situation” for a winning team – we leave that hard work up to the Neural Nets.
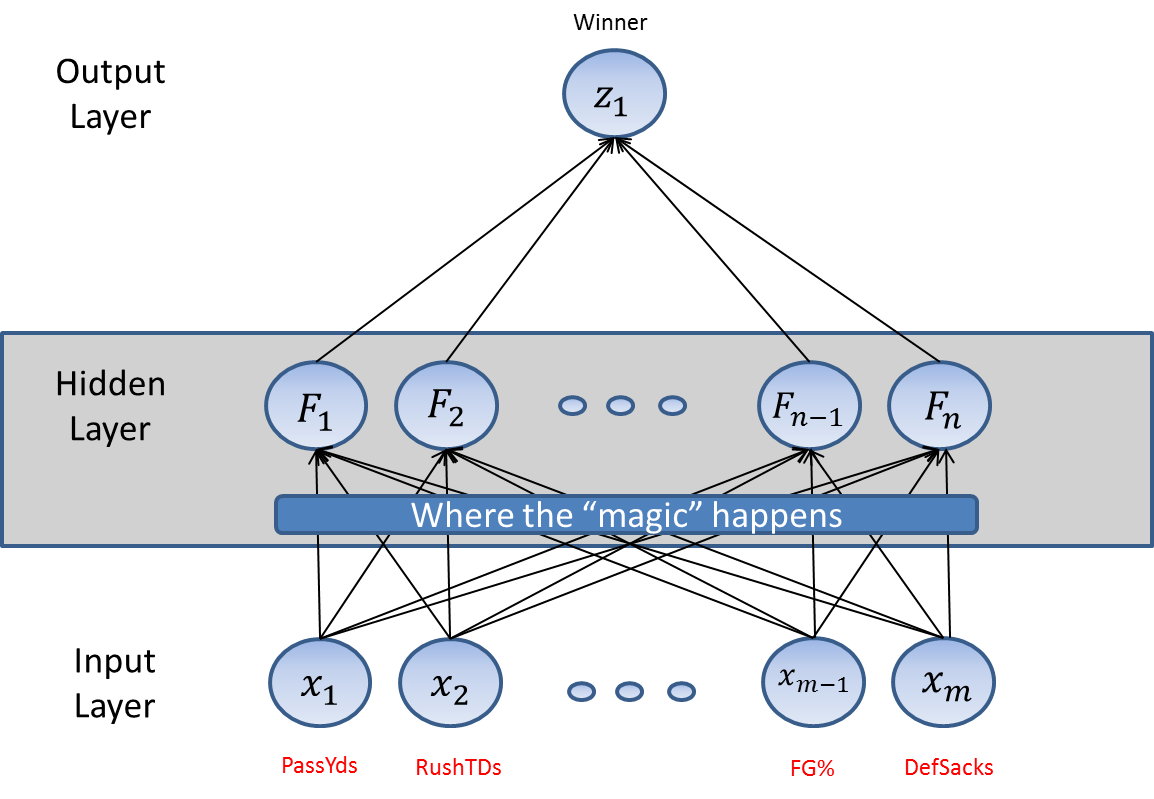
Neural Nets in a picture:
Visualize it!
Imagine a world with two sides: A and B. Every person belongs to either group A or group B. You must look at each person (their appearance, background, education, financial, history, genetics, etc.) and decide which group they belong to. This is exactly what our Neural Net does (picks whether a game belongs to the Away team or Home team).

This image shows a box, the true population and what group each person belongs to (represented by the letter A or B). The neural net will draw a line separating the two groups as best as it can (represented by the blue curved line). We see the line isn’t straight which means it’s non-linear. It attempts to group all the A’s together and all the B’s together based on some combination of Genetics and Education. We see the circled items were incorrectly grouped. If the model was perfect, every A would be on one side of the line and every B would be on another.
You are saying to yourself – this looks easy. It is important to remember the above image represents two factors (Genetics and Education). Say we chose 10 factors – we would be imagining this in a 10-Dimensional space – that’s enough to make you dizzy! Creating that “dividing line” is where the beauty of neural nets come into play.
Neural Nets Math:
Neural Nets take any number of inputs (i.e. stats) and produces a desired number of outputs (i.e. Game Winner, Spread Winner). The difficult part is the “hidden” layer which is where all the math takes place. Each node, or connection, in this layer contains some type of mathematical relationship known as Activation Functions. These Activation Functions include weighting, and some noise (think slop) to produce output weights. These output weights are then “combined” to produce a final result (output value). Whew! If you thought that was bad, here are some example functions inside the hidden layer:
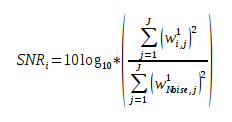
This is just a few of the many Activation Functions that can exist in the “hidden” layer of a Neural Net. Since there are many different types of Activations Functions, there are also many different types of Neural Nets. Probabilistic, Feed-Forward, Radial Basis are just a few of the many nets available.
Neural Nets in Action:
So how do you run an actual Neural Net – it may not be as bad as you think. There are three types of data that are necessary to create a valid net: Training, Test and Validation data. All three data sets have the same attributes, just different data. For example, say we are in week 6 of the NFL season and we have 5 weeks of data (you could use previous seasons, but choose not to for accuracy since so much changes between seasons).
We must split the 5 weeks of data into two of the three data sets (Training and Test). We take 4 weeks of the data and put it in the Training Set and the remaining week goes into the Test set (any percentage can be done – they just must not overlap). The Training set is used to “build” the model and the Test set is used to “tweak” the model. The output of the model is either a 0 or 1 (home loss/win). Once we have a “good” model – determined by multiple tries and deeper analysis, this model is then used for Week 6.
Week 6 games have not been played yet, so some type of data (Validation set) must be created to input in the model. Different methods include season averages, last 5 games averages, Home/Away averages, etc. Once the data is calculated, it is simply plugged into the model and an answer of 0 (away win) or 1 (home win) is returned. That’s it!